
Monitor Tableau Cloud Deployments of Any Size with the Platform Data API

Tableau puts self-service visual analytics within reach of everyone, from small businesses with just a few licenses to massive enterprises deploying it across their entire organization.
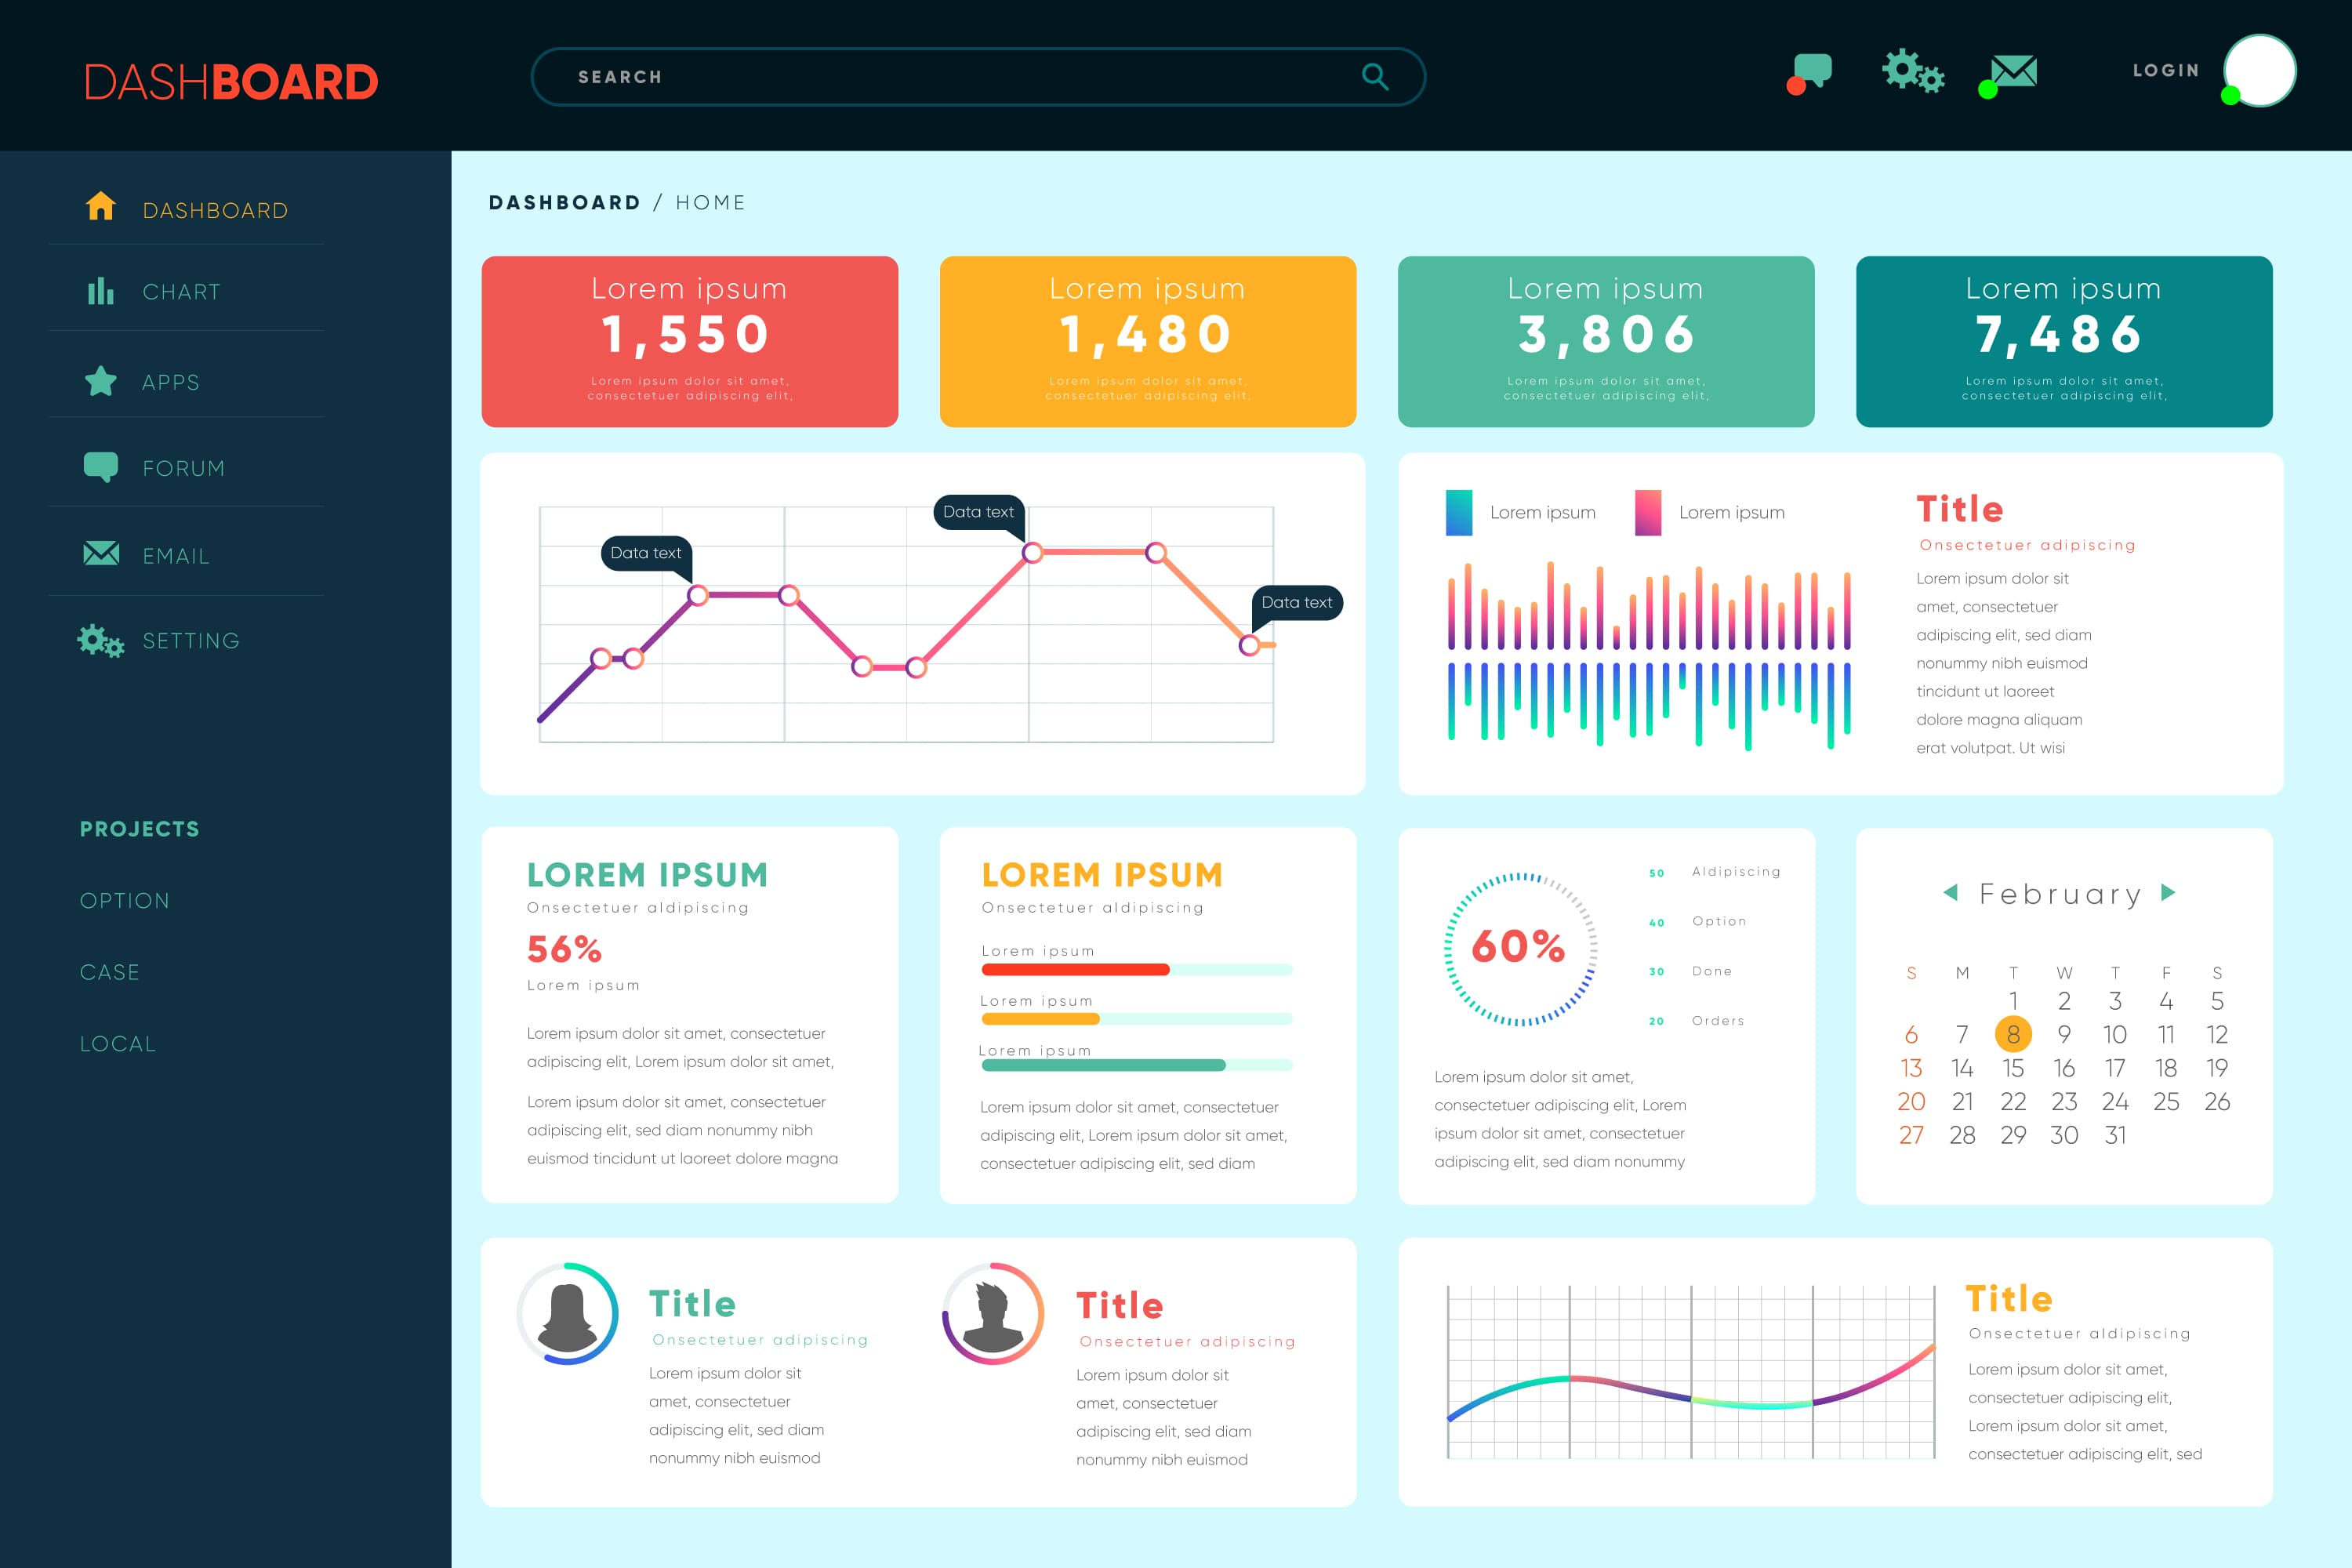
Dashboards Aren’t Dead, They’re Evolving. And So Is Tableau.
Ten years ago, machine learning vendors said the model would “tell you everything.” Automation platforms claimed decisions would “run themselves.” And more recently, the metrics layer movement insisted SQL alone would eliminate the need for visual analytics.
How to ensure accuracy in your research with IBM SPSS Statistics

By using IBM SPSS Statistics, researchers can safeguard the integrity of their work and its impact across industries. IBM SPSS Statistics provides a comprehensive suite of tools for precise data analysis and maintaining rigorous standards for accuracy.
Accelerating yield improvement: Root cause analysis in semiconductor manufacturing

Semiconductor manufacturing is one of the most complex production environments in the world. Each wafer passes through hundreds of tightly controlled process steps, with thousands of variables that can influence yield and quality. Even minor deviations in temperature, pressure, or chemical composition can lead to costly defects, delayed deliveries, and lost revenue.
Beyond the silos: Unifying statistical power with SPSS Statistics, R and Python

IBM® SPSS Statistics is a leading comprehensive statistical software that provides predictive models and advanced statistical techniques to derive actionable insights from data. For many businesses, research institutions, data scientists, data analyst experts and statisticians, SPSS Statistics is the standard for statistical analysis.
What’s next for IBM SPSS Statistics

Delve into the enhanced power of
version 31
Hauntingly easy data tricks: Tips for organizing and analyzing mixed methods data

Mixed methods research doesn’t have to be overwhelming—structured data collection and smart use of tools like NVivo, ATLAS.ti, and XLSTAT can simplify the entire process. From transcribing interviews to organizing field notes and running statistical analyses, staying disciplined and methodical is the key to turning messy data into meaningful insights.
Behind the breakthroughs: Using XLSTAT to understand consumer acceptance of biofortified foods

Consumer acceptance is critical for the success of biofortified foods—nutritional value alone isn’t enough. Using XLSTAT, researchers uncovered that sweetness, light texture, and smooth mouthfeel were the strongest drivers of preference for kisra made with nutrient-rich sorghum.
Exploring Partial Least Squares Structural Equation Modeling

Exploring Partial Least Squares Structural Equation Modeling (PLS-SEM) Applications in Supply Chain Research: A Bibliometric Analysis and Science Mapping Approach
Exploring the application of PLS-SEM in business, management, and accounting research

Sustainability and social media have emerged as dominant research themes, while critical methodological concerns, including overuse and validity issues, remain insufficiently addressed.