

Tableau

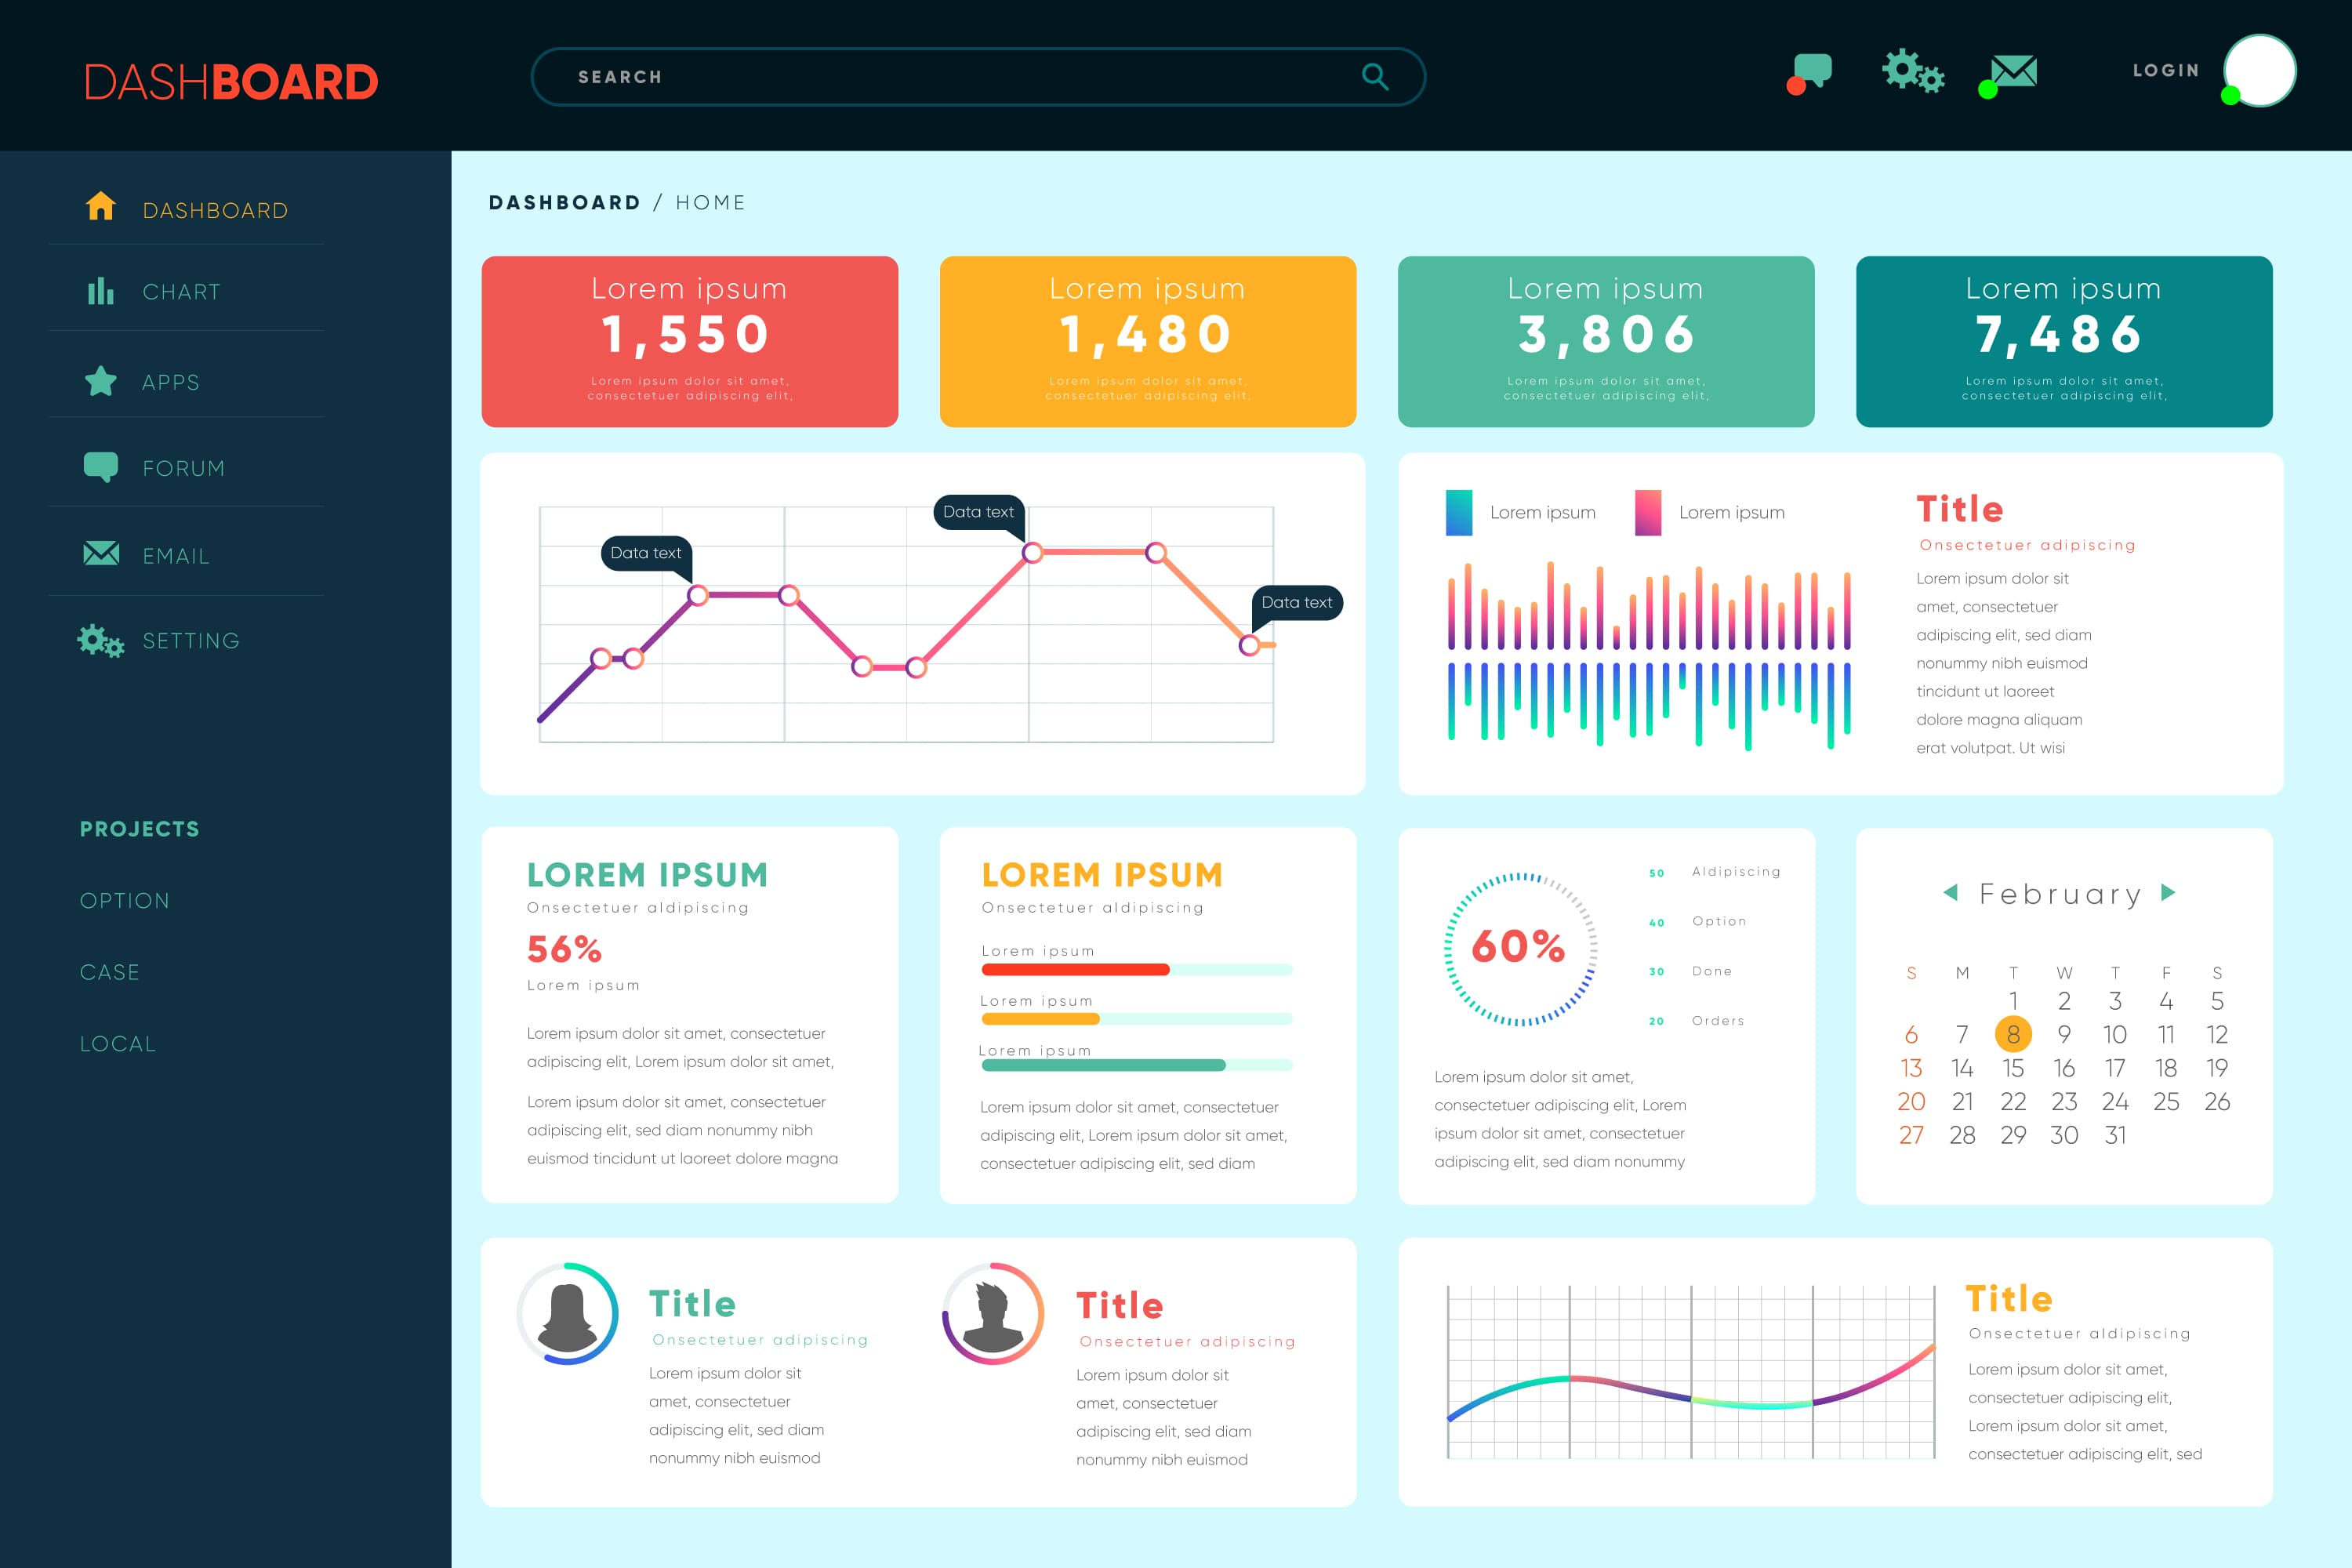
Create compelling dashboards that reveal patterns and outliers.

Tableau Icon

Tableau lets organisations analyse data visually through interactive dashboards and exploratory analytics. It delivers fast insights, self-service analysis, and enterprise sharing across desktop, server, and cloud environments.

Features

Use Cases

Explore insights that inspire impact — with Tableau

Executive & Management Dashboards

Track KPIs, trends, and organisational performance visually.

Business & Operational Analytics

Teams analyse operations, efficiency, and performance metrics in one place.

Sales & Marketing Analysis

Monitor sales trends, customer behaviour, and campaign effectiveness.

Exploratory Data Analysis (EDA)

Discover patterns, outliers, and insights through visual exploration.

Public Sector & Transparency Dashboards

Share insights and performance metrics with internal teams or the public.

Industries

Education

Supports institutional reporting and student performance analysis.

Healthcare

Used for operational, clinical, and performance analytics.

Business & Enterprise

Used for performance analysis, reporting, and decision support.

Government & Public Sector

Supports monitoring dashboards, analytics, and data transparency.

Retail & Consumer Goods

Analyses sales performance, customer trends, and demand patterns.

Explore More

Turning Data Into Decisions, Empowering Education Through Innovation.

Partner with Statworks to unlock smarter analytics, advanced solutions, and transformative education technologies tailored to your goals.